Dell - Events Calendar App
Context
The business development team had no shared way to track or coordinate events across departments, field and office staff were working from complicated and oudated Excel files.
Audience
Two user groups with different needs from the same data: field BDMs entering and tracking their own events, and the Head Office Manager monitoring participation across all of them.
Build
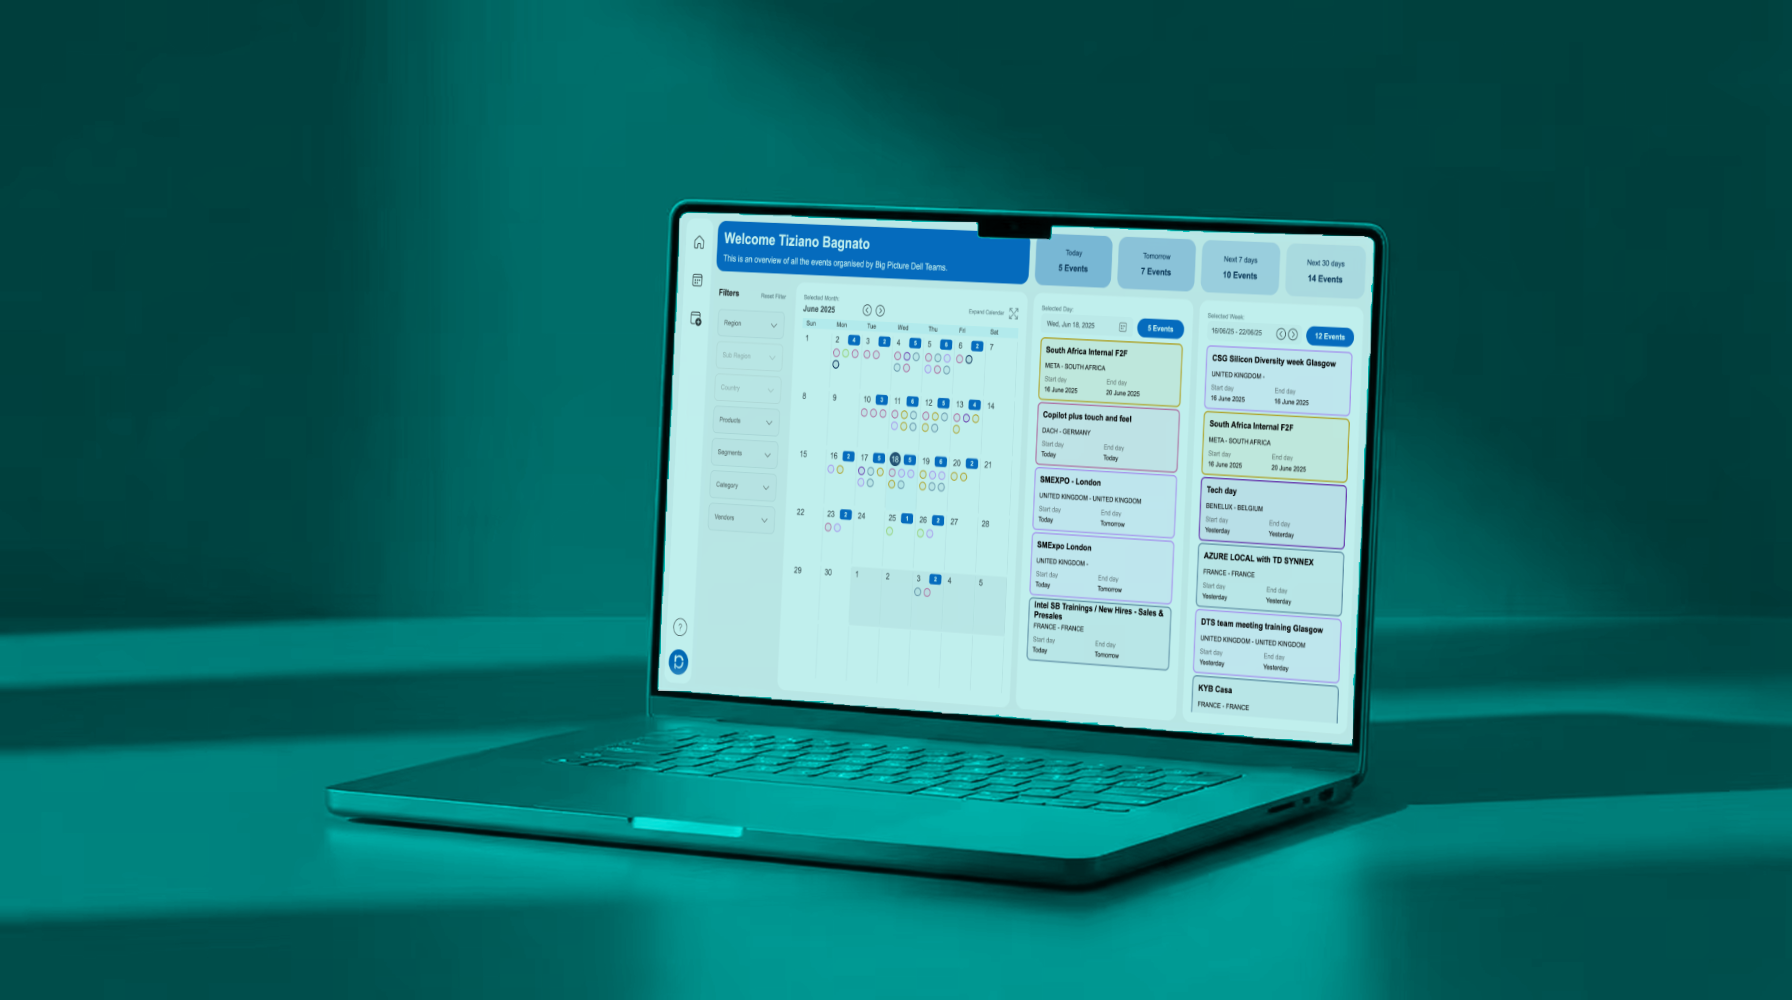
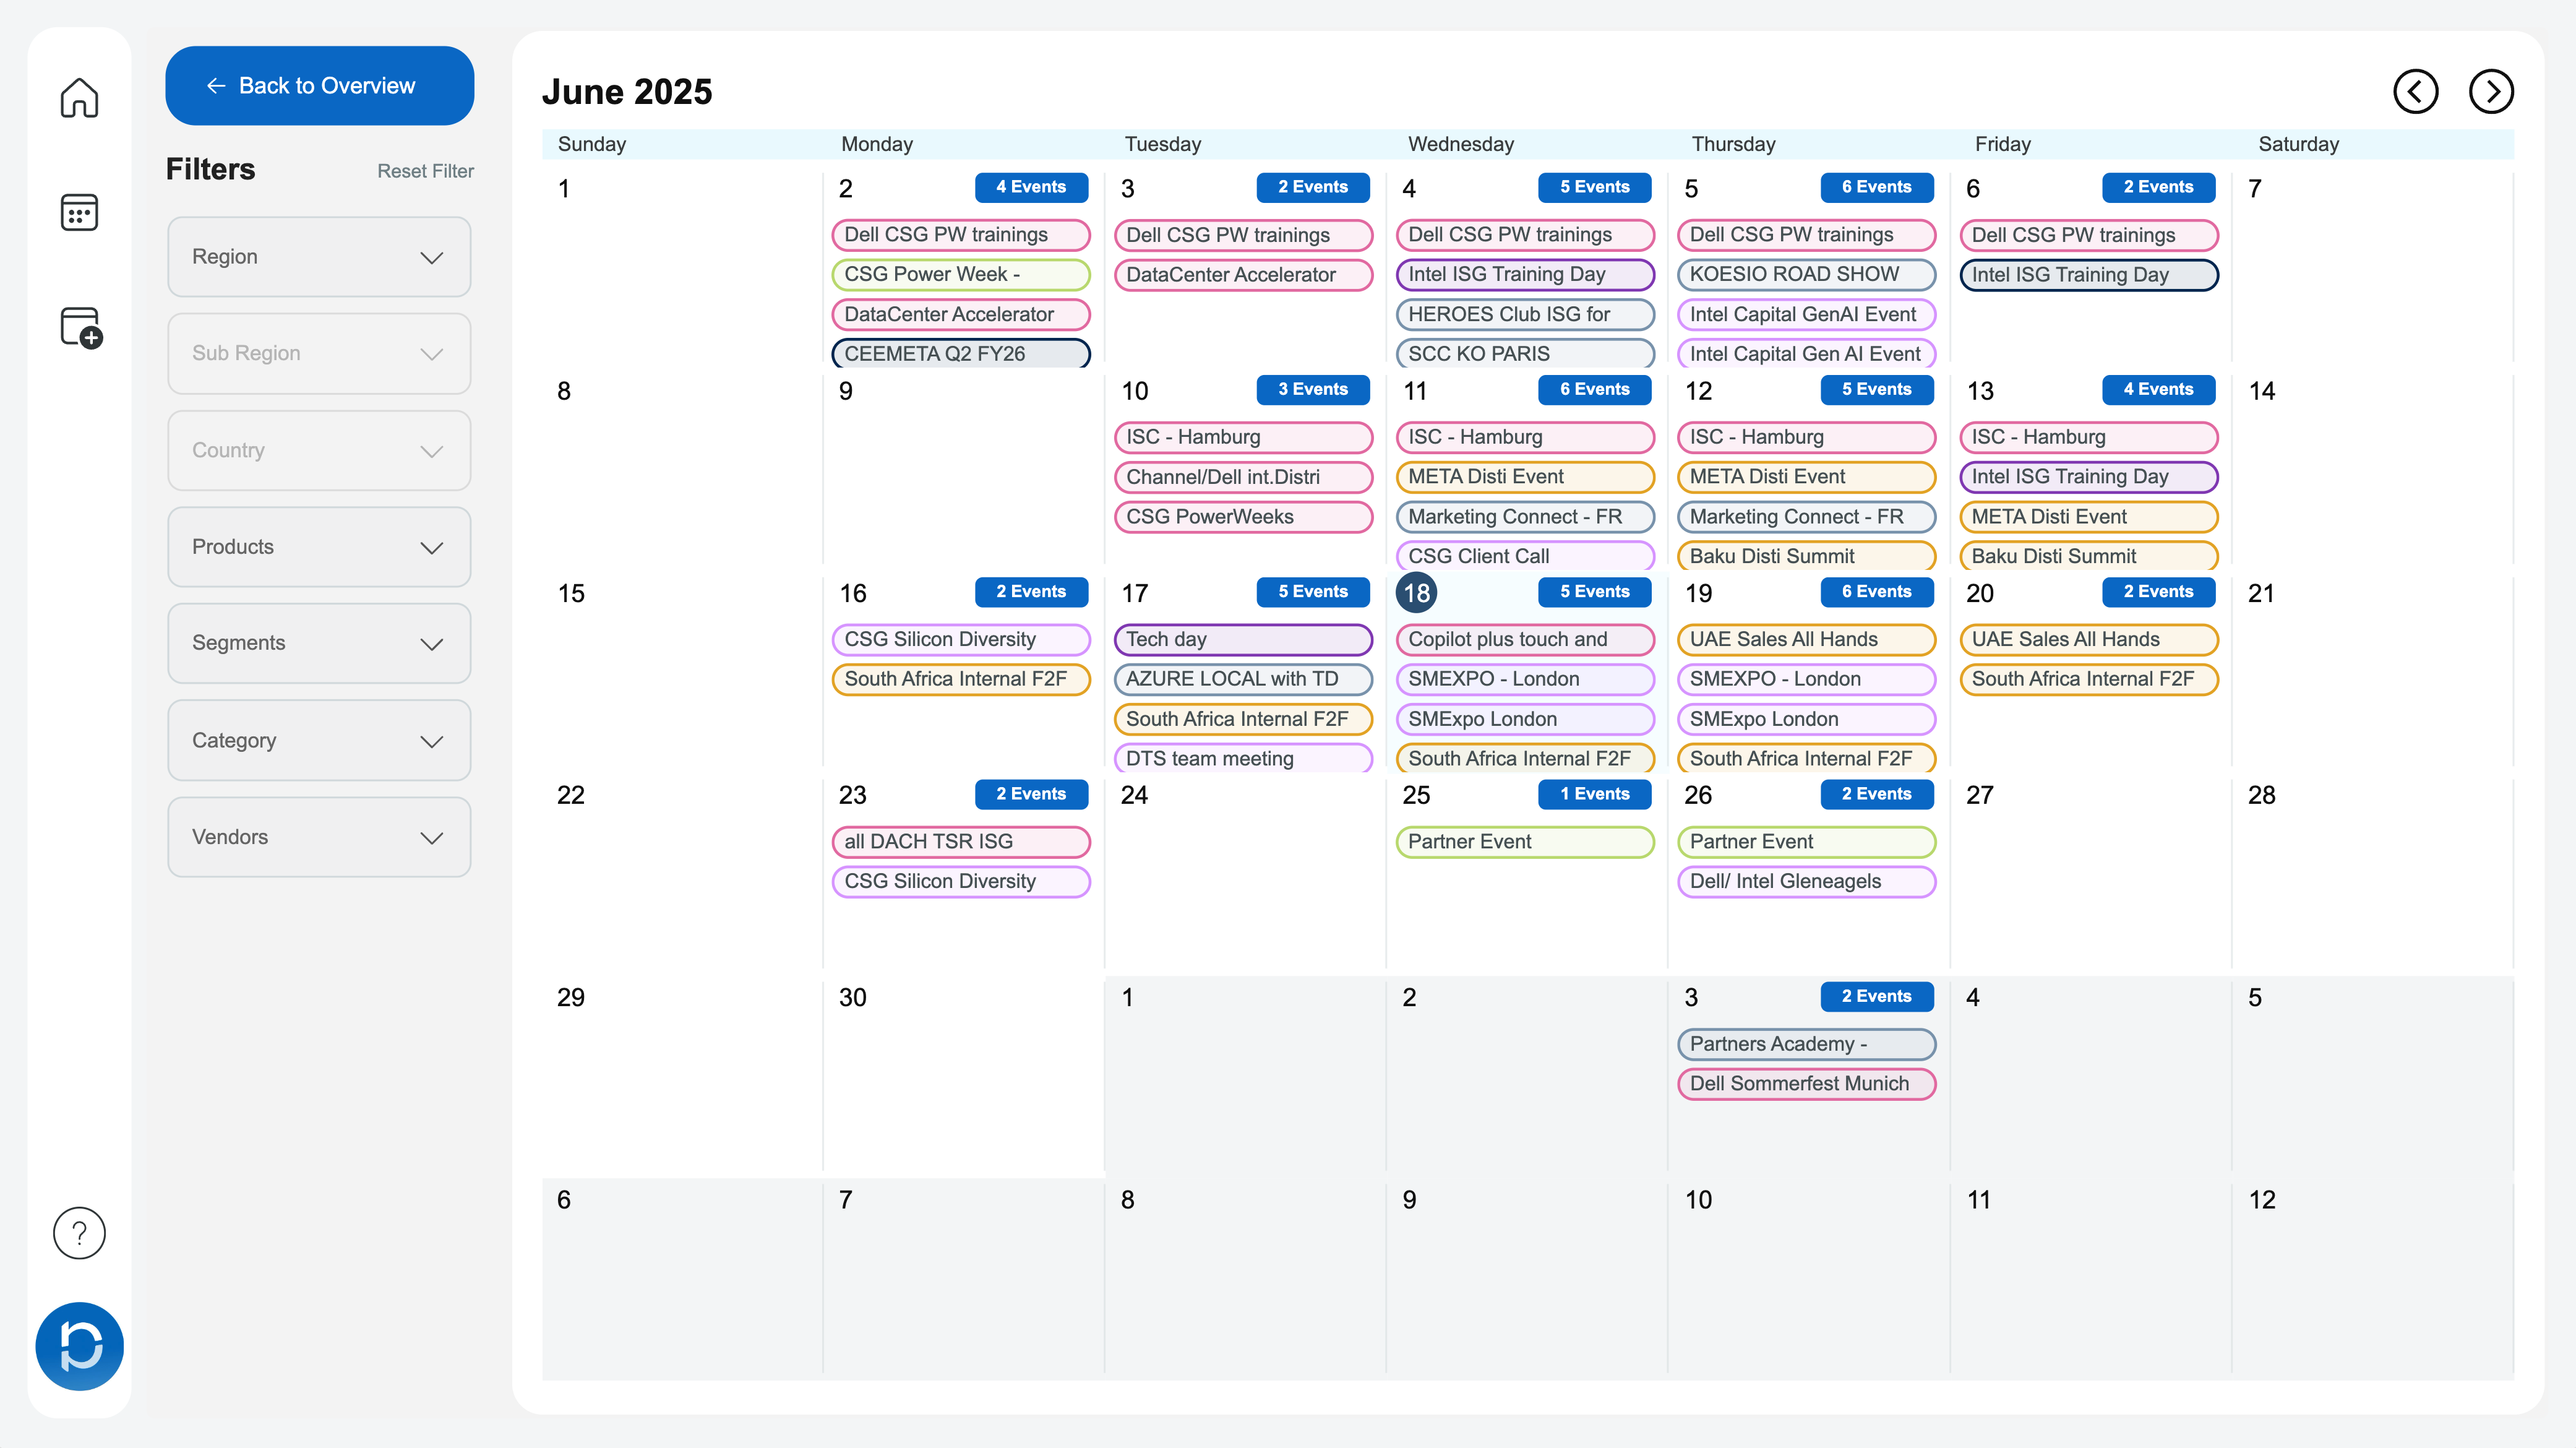
The core design problem was density. A lot of events, several departments, and two audiences who needed to read the same dataset in different ways — the field teams working event by event, the office watching everything at once.
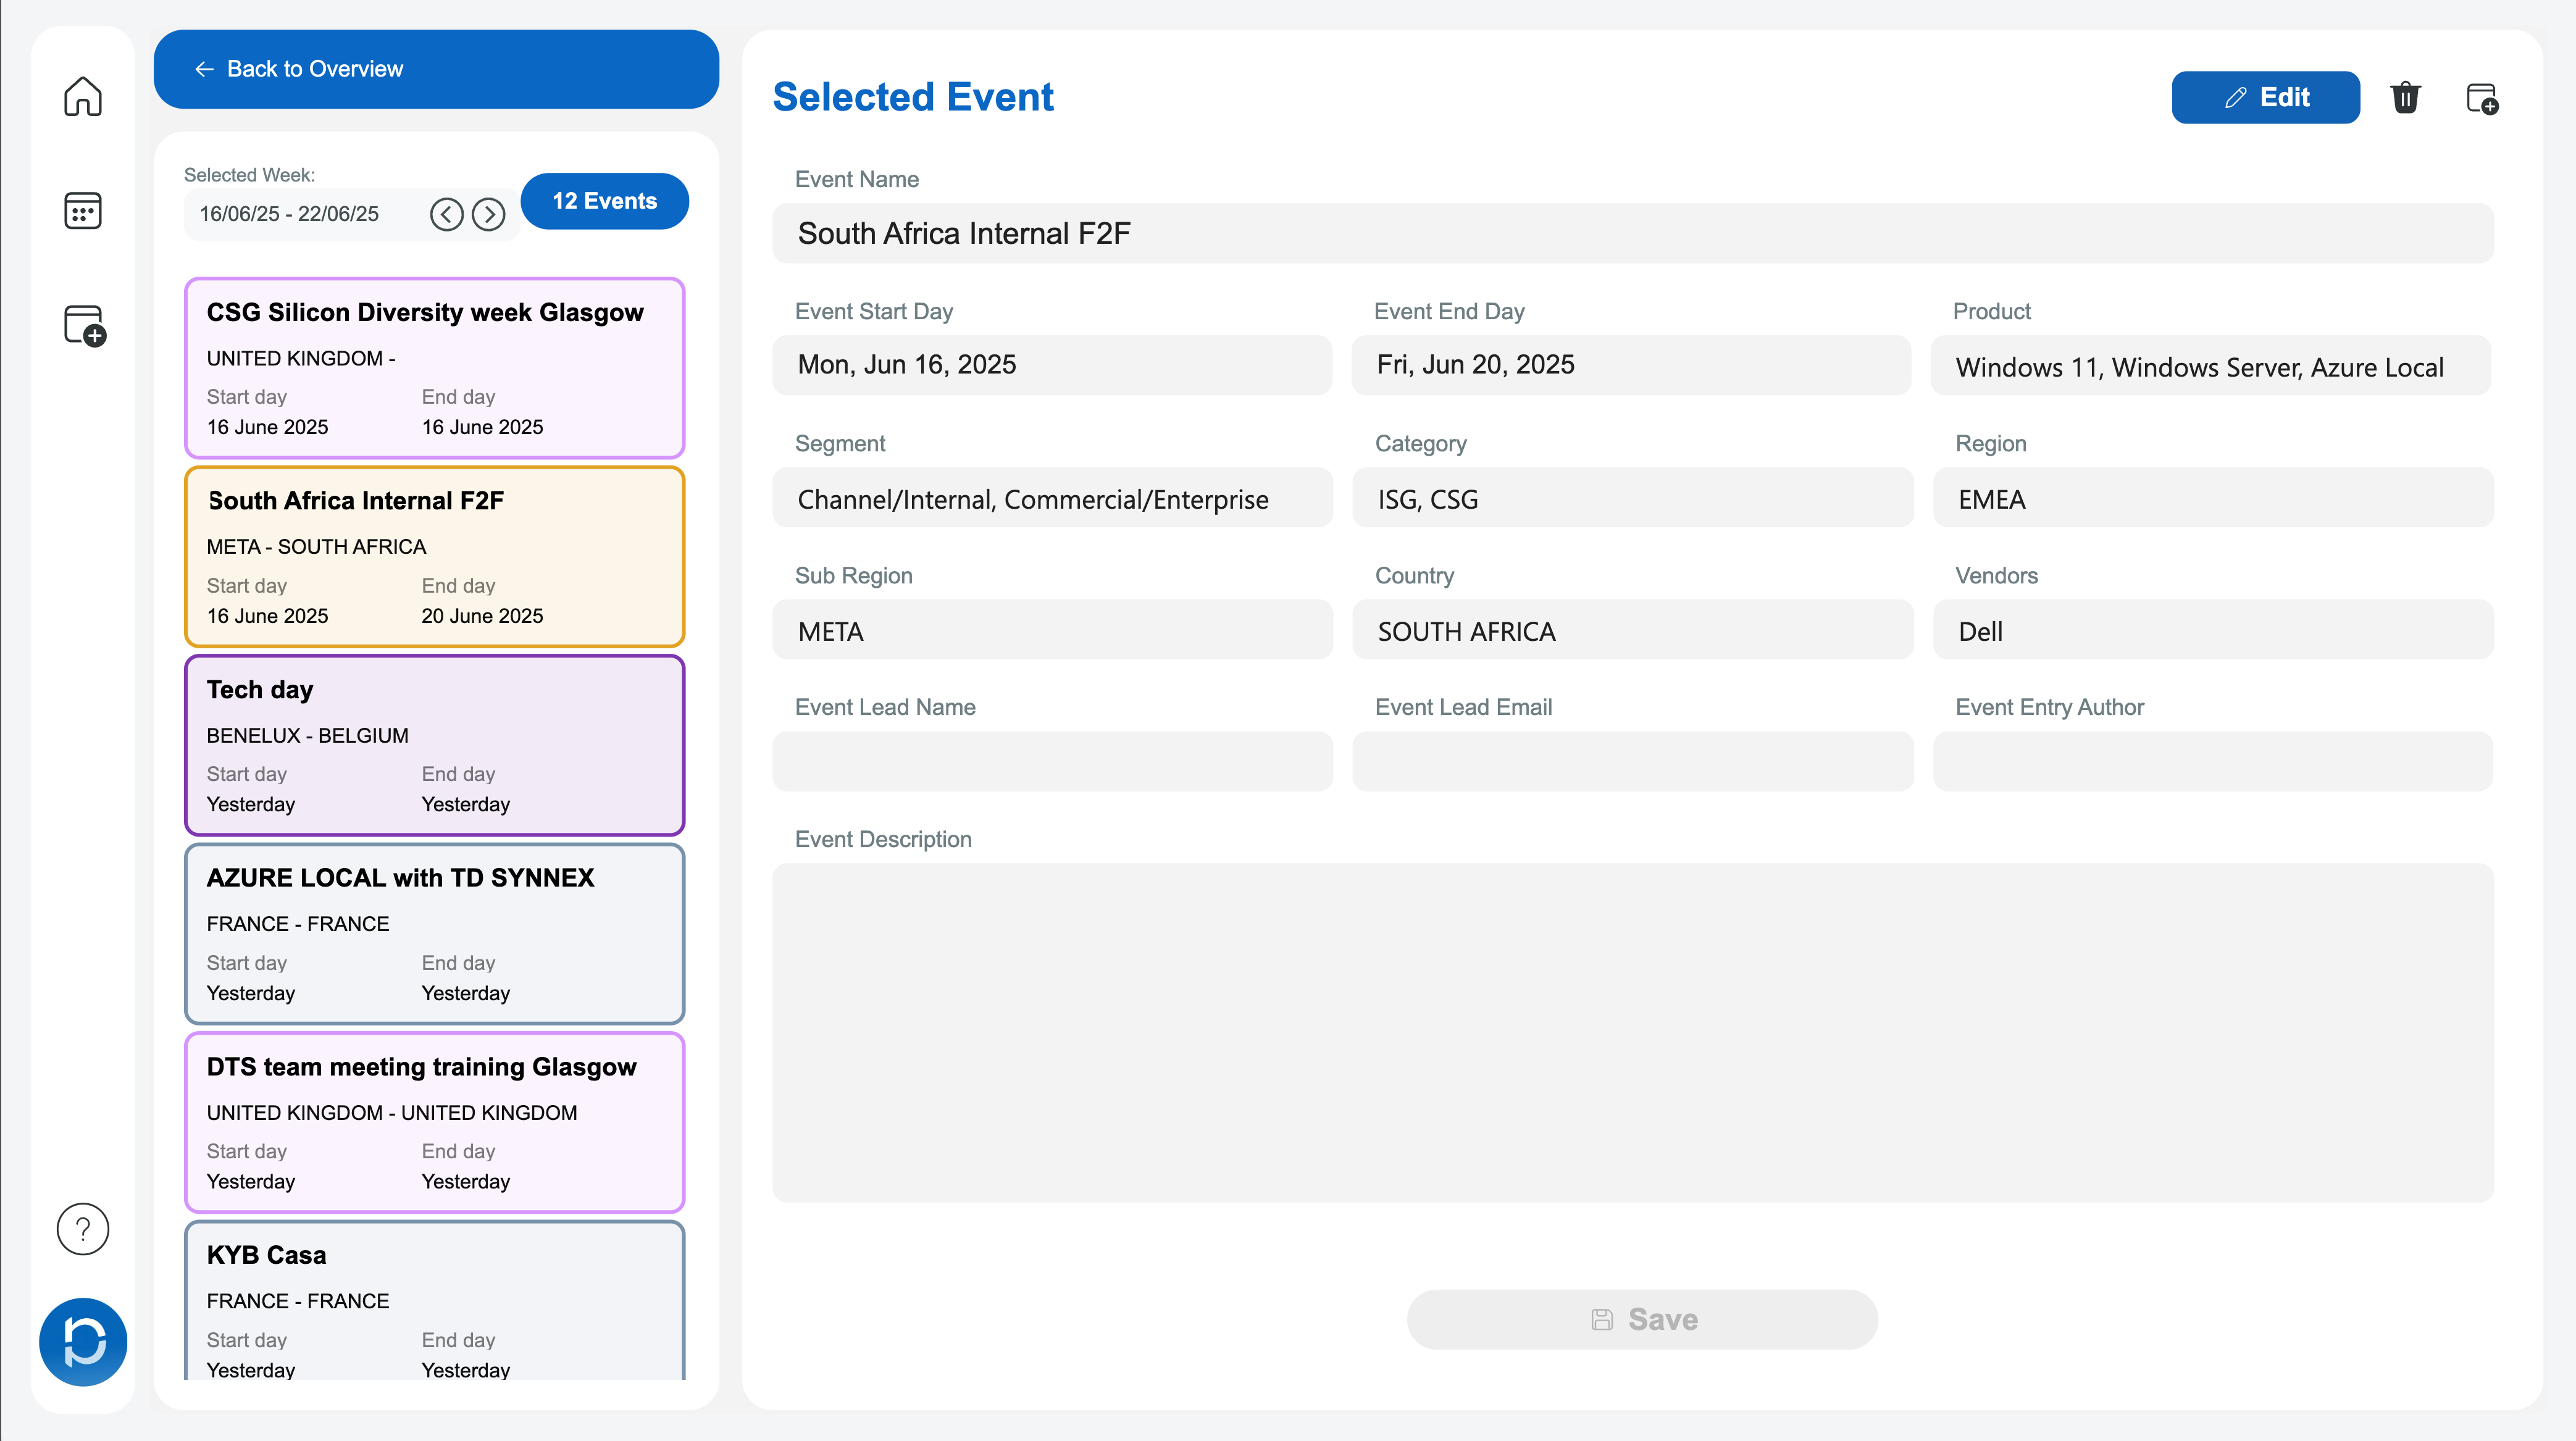
I designed a single dashboard in PowerApps that presents one event dataset at three zoom levels — monthly for planning, weekly for coordination, daily for execution — so each user could work at the granularity that suited them without switching tools or duplicating data. On top of that sits a filter layer cutting across date, location and department, so a manager can isolate exactly the slice they need from a dense list rather than scroll it. Each event opens to its own page with view, edit and update handled in place, so details can change without the overview breaking around them. SharePoint underneath holds the shared data, so every department reads from one source rather than separate copies drifting apart.
After launch
Performed user training and documentation. Maintained after launch; later absorbed into the Big Picture Hub.
Outcome
Scheduling conflicts reduced, and managers gained one place to monitor event participation.


More Works